

Greater Annapolis Q3 2026: A Higher Median, Fewer Closings
Sales above $1 million increased. Waterfront sales had shorter reported marketing times. A closer look at the quarter shows why the segment matters.
Greater Annapolis recorded fewer residential closings in the third quarter of 2026, while the median closing price increased. Within that overall picture, sales above $1 million grew, and the waterfront homes that closed had a much shorter median time on market.[^data]
Our read: the countywide headline is a useful starting point. The detail becomes more relevant when you look at the price range and property type you’re actually following.
For this report, Greater Annapolis means Anne Arundel County. We’re comparing July through September 2026 with the same three months in 2025, using the reviewed residential closed-sale exports in our market database.[^data]
The quarter at a glance
Measure | Q3 2026 | Q3 2025 | Year-over-year change |
|---|---|---|---|
Recorded residential closings | 1,990 | 2,105 | −5.5% |
Median closing price | $525,000 | $500,000 | +5.0% |
Closings above $1 million | 207 | 179 | +15.6% |
Waterfront median closing price | $1,320,000 | $1,100,000 | +20.0% |
Waterfront median reported time on market | 16 days | 30.5 days | −14.5 days |
Source: Housecats analysis of reviewed Bright MLS exports. Luxury and Waterfront are overlapping subsets of the overall sales population.[^data]
1. A higher median price accompanied fewer closings
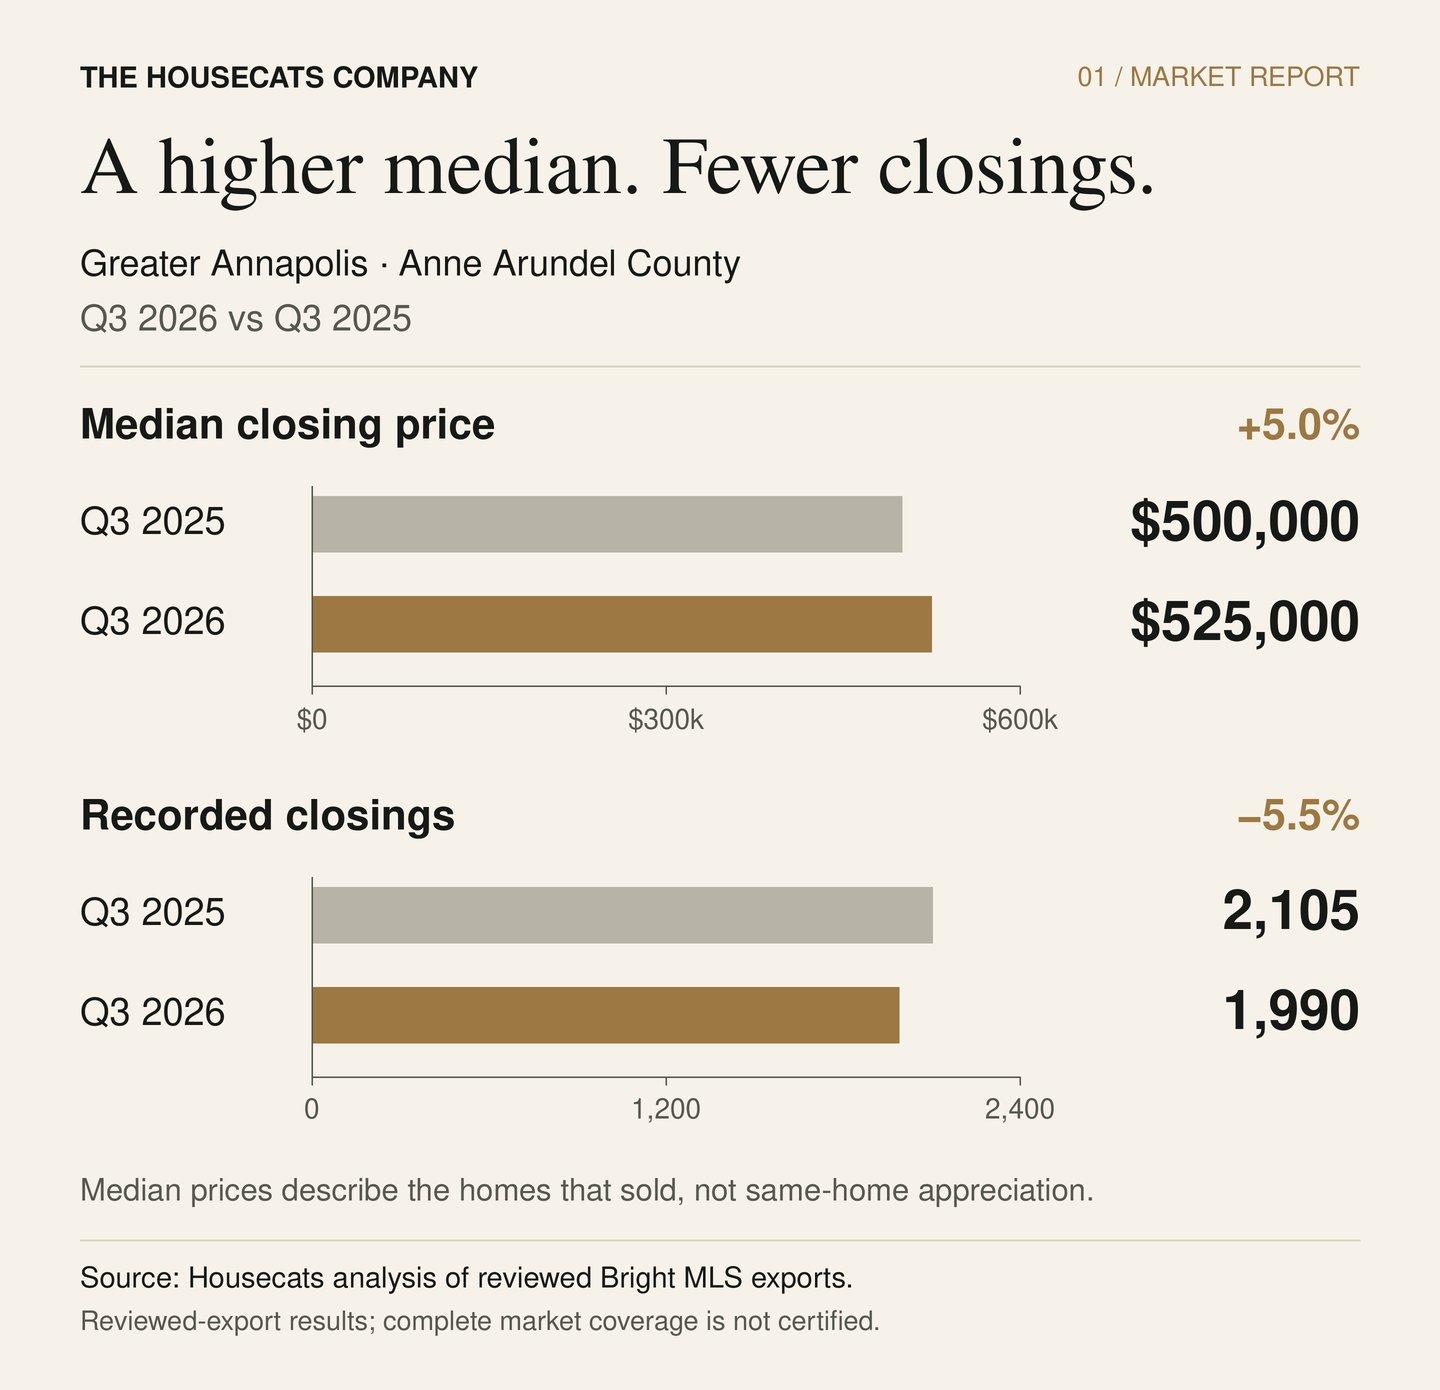
The overall median closing price reached $525,000, up 5% from $500,000 a year earlier. At the same time, recorded closings declined from 2,105 to 1,990—a decrease of 5.5%, or 115 sales.[^data]
Those two measures answer different questions. The transaction count tells us how many qualifying sales closed. The median tells us the midpoint of their closing prices.
Together, they describe a quarter with less completed transaction activity and a higher midpoint among the homes that sold. The mix of those homes matters: different locations, property types and price ranges can change the median from one period to the next.
An individual property still needs its own set of relevant comparisons. A countywide increase in the median cannot establish how much that particular home’s value changed.
2. More homes sold above $1 million
The upper end accounted for a larger share of completed sales.
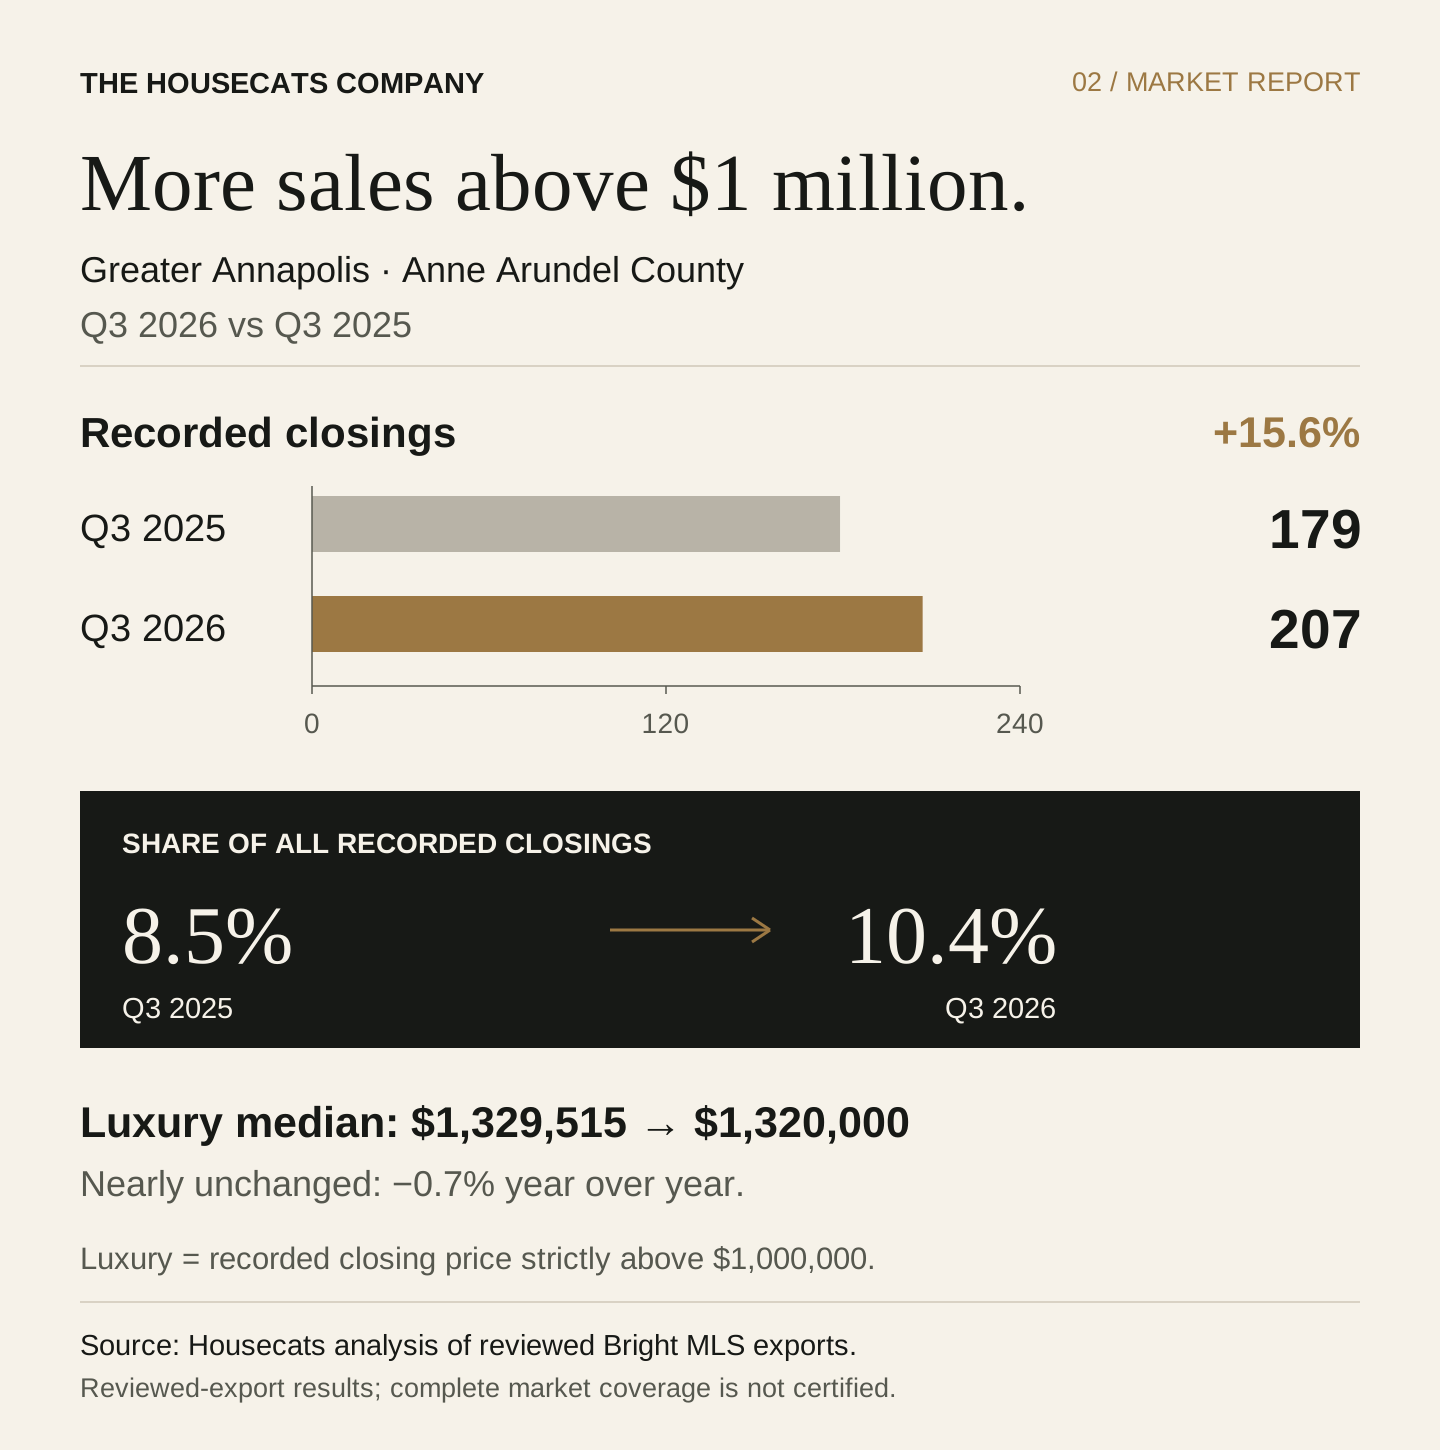
There were 207 closings above $1 million, compared with 179 in Q3 2025. That is an increase of 15.6%. Their share of overall closings rose from 8.5% to 10.4%.[^data]
For this analysis, our Luxury segment includes closing prices strictly above $1 million. A sale at exactly $1 million falls outside that definition.
There is a useful detail behind the increase in activity: the segment’s own median closing price was nearly unchanged. It came in at $1.32 million, down 0.7% from $1,329,515 a year earlier.[^data]
The clearest signal is the increase in completed transactions at that price level. More homes sold above $1 million, and those sales made up a larger share of the quarter’s total.
3. Waterfront sales had a shorter median time on market
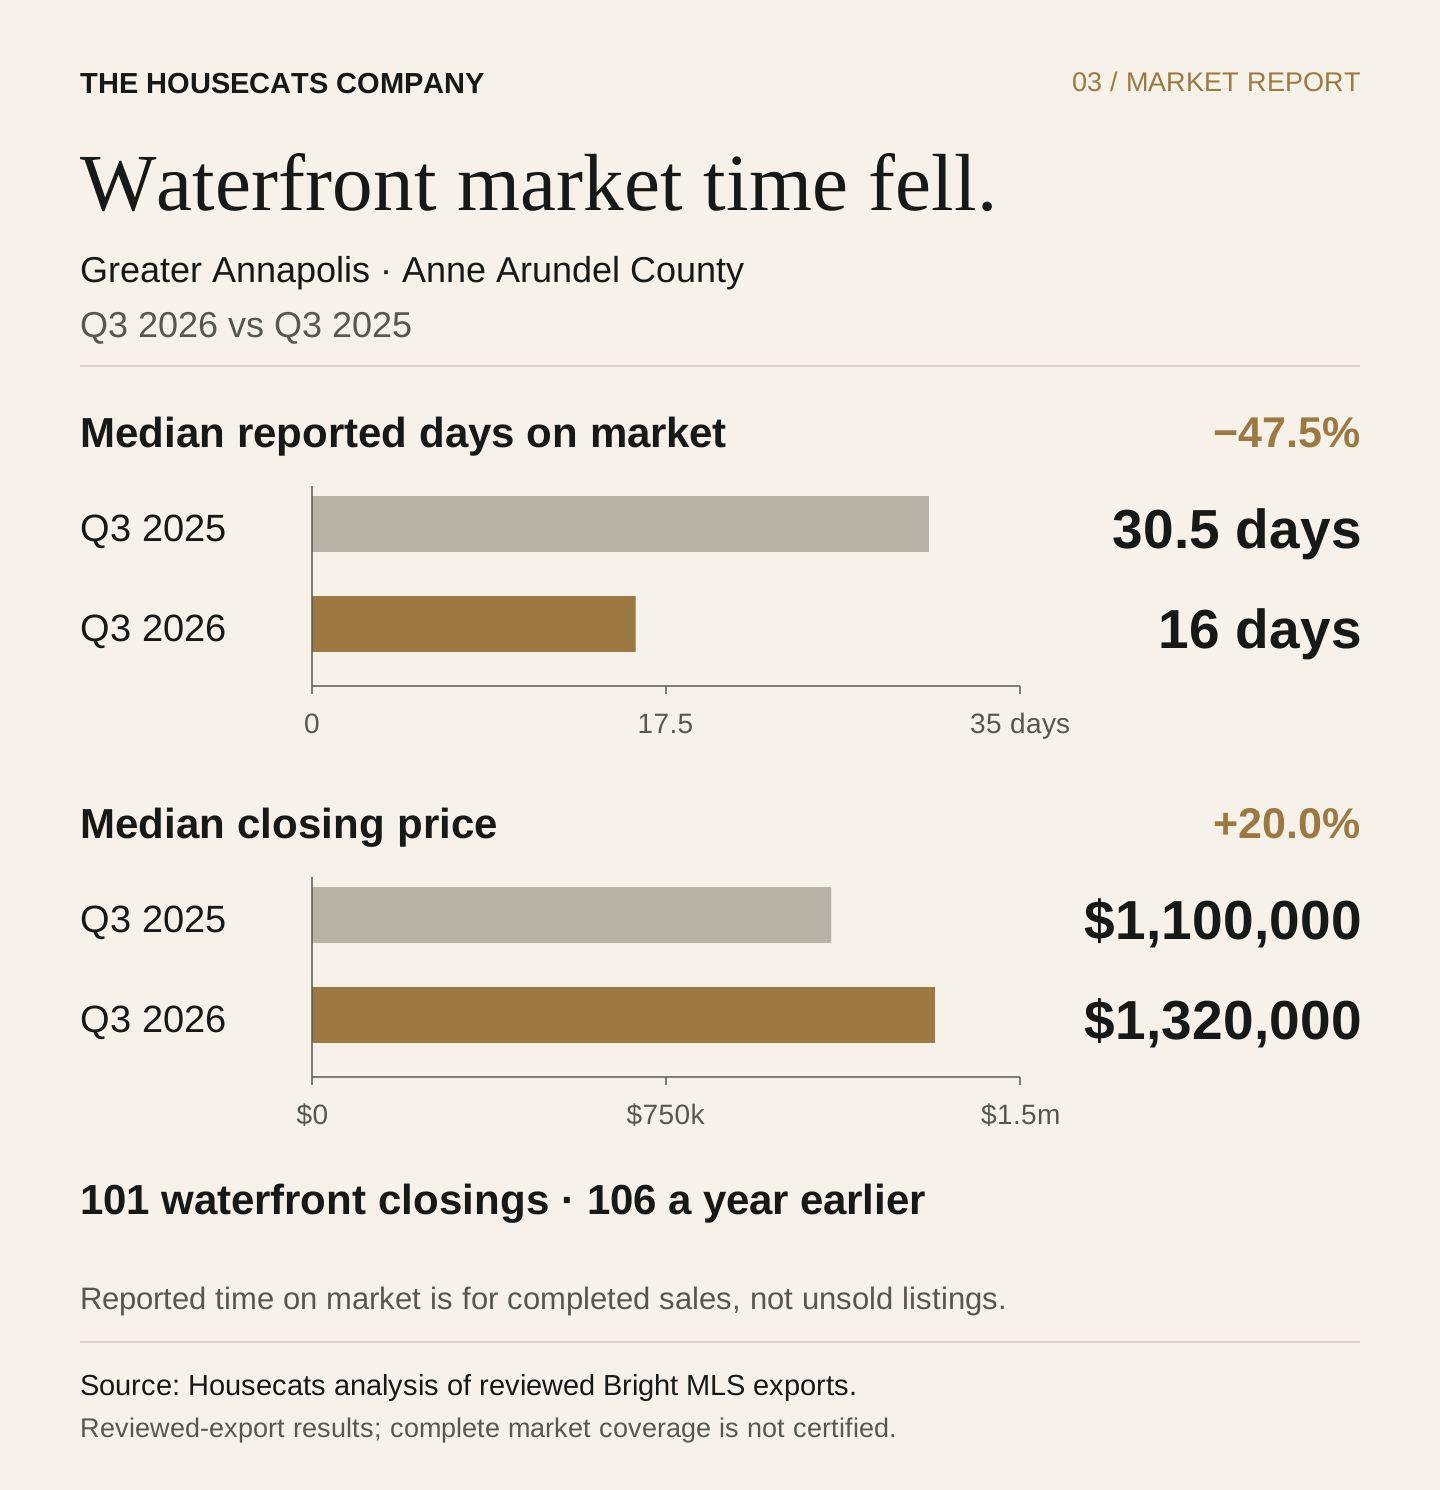
Among the waterfront homes that closed, median reported time on market fell from 30.5 days to 16 days. That is a reduction of 14.5 days, or 47.5%.[^data]
The waterfront median closing price also increased, reaching $1.32 million, compared with $1.1 million a year earlier. Recorded waterfront closings totaled 101, versus 106.[^data]
The difference in marketing time deserves attention. Across the overall population, median reported time on market was 12 days, compared with 11 a year earlier. The waterfront result followed a different pattern.[^data]
These figures describe the waterfront properties that completed a sale during the quarter. They do not establish a timeline for an unsold listing. The 20% increase in waterfront median price also reflects different homes selling in each period; it is not a measure of appreciation for an individual waterfront property.
At the top of the market
These were the three highest recorded closing prices in the reviewed Greater Annapolis Q3 sales. All three properties were designated Waterfront in the source data.[^data]
Property | Closing price | MLS close date |
|---|---|---|
622 Magothy Road, Gibson Island | $7,500,000 | July 29, 2026 |
654 Round Hill Road, Gibson Island | $7,200,000 | August 3, 2026 |
464 Arundel Beach Road, Severna Park | $6,250,000 | September 4, 2026 |
622 Magothy Rd Gibson Island $7,500,000 |
654 Round Hill Rd Gibson Island $7,200,000 |
464 Arundel Beach Rd Severna Park $6,250,000 |
|---|
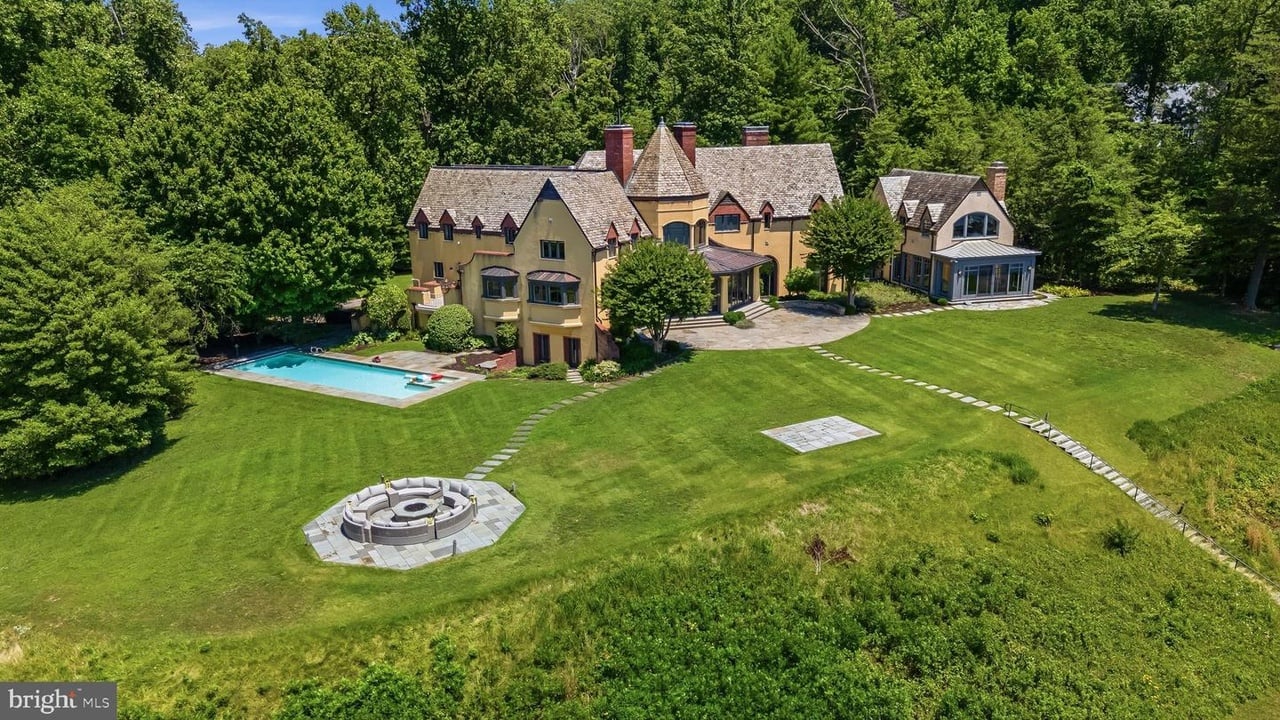
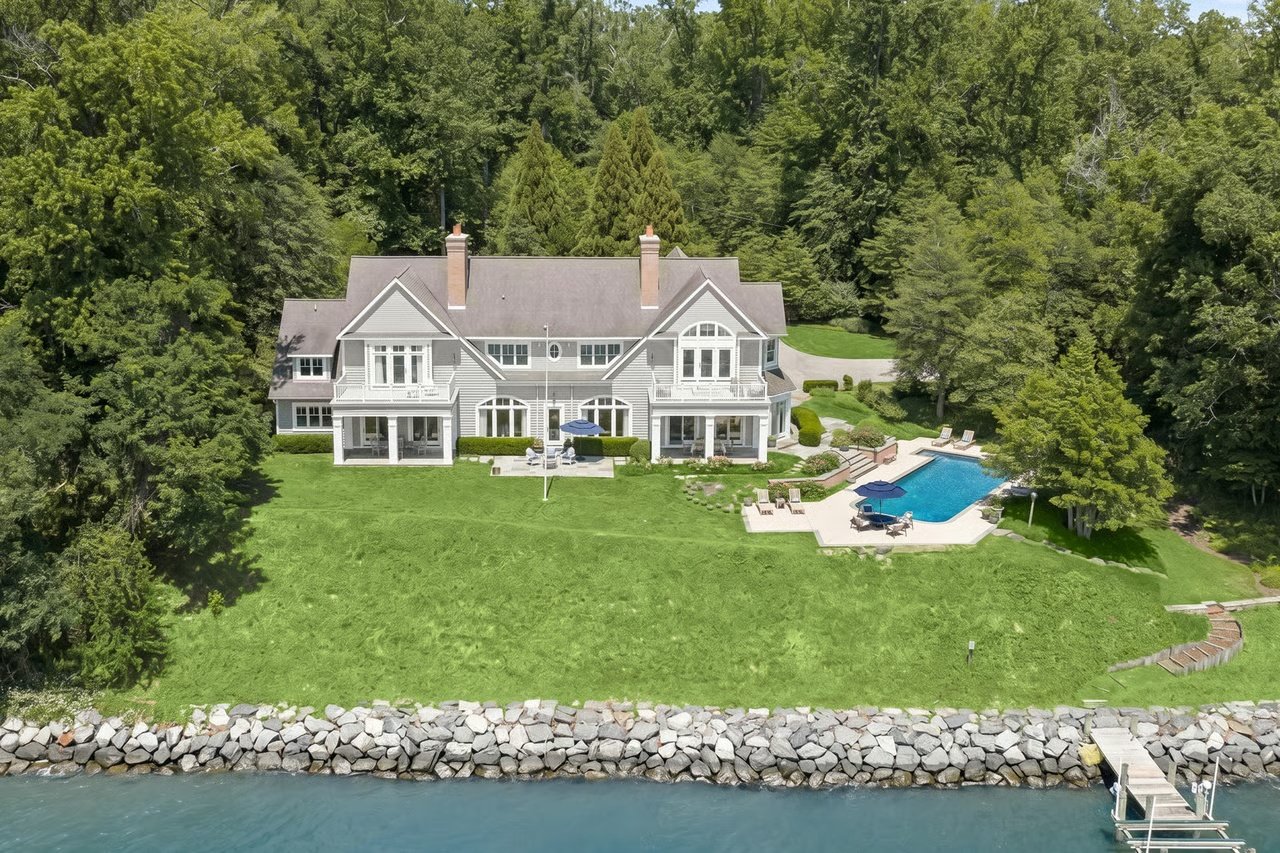
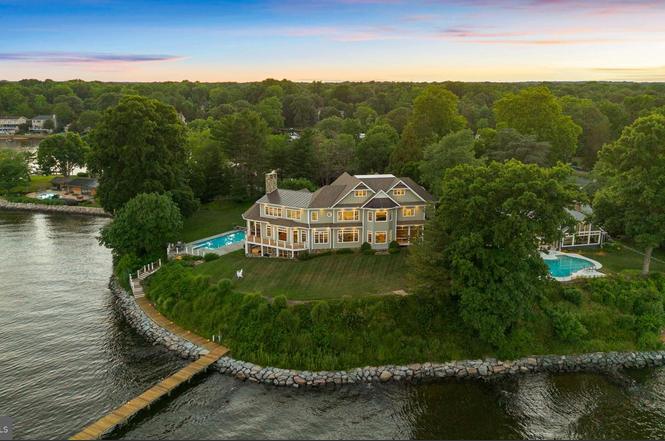
Public broker records corroborate the property addresses and sold prices. Dates above reflect the reviewed MLS closing dates; public-record dates can differ. Gibson Island Real Estate, Inc.
These transactions show the upper end of the quarter’s recorded activity. Their prices and locations provide context for that part of the market; a broader range of sales remains essential when evaluating other properties.
What we’ll be watching next
The next quarter will give us a chance to see whether sales above $1 million continue to account for a larger share of activity, and whether waterfront marketing times remain below the prior-year comparison.
We’ll also be watching the number and mix of closings alongside the median price. Reading those measures together gives a more useful picture than relying on any single headline.
A closer look at your part of the market
Following a particular area, property type or price range? Let’s put the relevant sales in context and discuss the questions that matter for your next move.
Source and methodology
Figures reflect qualifying residential closed sales in six reviewed Bright MLS exports for Anne Arundel County, covering July–September 2026 and July–September 2025. Source files were exported October 19 or October 26, 2026. Quarterly medians were calculated from individual qualifying sales.
Luxury means a closing price strictly above $1 million. Waterfront requires the source’s explicit waterfront designation; water access alone does not qualify. Results describe the reviewed exports; complete county-market coverage has not been independently certified.