

Imagine two people renewing their leases. One has found a place that works: the rent is manageable, the commute is short, and family is close. The other has spent weeks looking for an alternative but cannot put together a deposit, a moving bill and a month of overlapping rent. If each is still there a year later, both count exactly the same way in the Census Bureau’s residential mobility data. Their choices could hardly be more different.
That’s the trouble with calling Maryland’s young adults an “immobile generation.” The address data can tell us whether people moved. They don’t tell us whether staying was what people wanted. Before we make a claim about a generation, it helps to get the narrower question right: among Maryland residents ages 25 to 44, how many reported living somewhere else a year earlier?
Roughly one in six moved
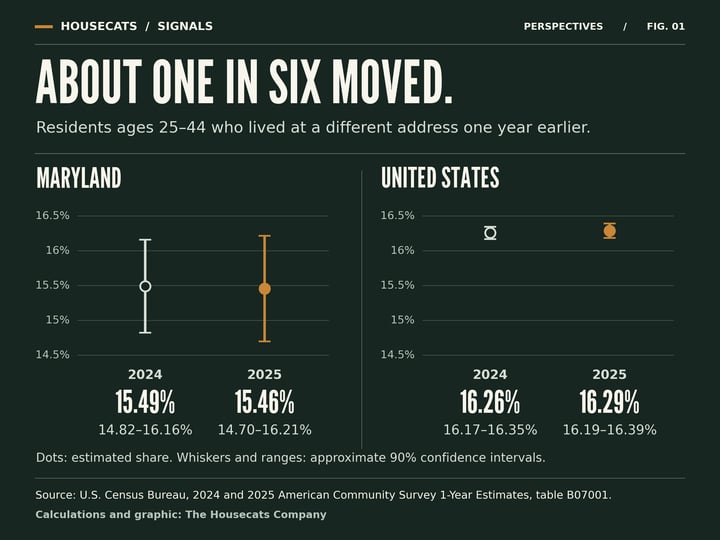
In the 2025 American Community Survey, an estimated 260,602 of Maryland’s 1,686,135 residents ages 25–44 lived in a different home one year earlier. That puts the estimated Maryland move rate at 15.46%, with an approximate 90% confidence interval of 14.70% to 16.21%. Nationally, the corresponding estimate was 16.29%, or 15,003,356 out of 92,103,543 residents in the same age range; the approximate interval was 16.19% to 16.39%.
Maryland’s point estimate was lower than the national one. The difference is less than one percentage point. It would be a stretch to read those two figures as evidence that people across Maryland face a fundamentally different set of choices from everyone else. A state average is a broad comparison; it isn’t a description of the alternatives available to the renter whose lease is up this month.
The year-to-year comparison is more revealing. The 2024 survey, calculated the same way, put the Maryland share at 15.49%: 260,907 movers out of 1,684,085 residents, with an approximate 90% confidence interval of 14.82% to 16.16%. The national estimate was 16.26%, or 14,982,024 out of 92,155,290, with an interval of 16.17% to 16.35%. Each point estimate changed by less than four hundredths of a percentage point between surveys. These figures don’t establish a one-year collapse in mobility, or a ranking of 2025 against every year since 2014.
A move across the street counts
The Census question asks current residents where they lived one year earlier. It does not compare the same respondents in two consecutive annual surveys. The categories in table B07001 distinguish the same home from a different home in the same county, another county in the same state, another state, or abroad. We combined the four age bands from 25 through 44. The denominator is everyone in those age bands who now lives in the geography; the numerator is everyone except those in the same home. The ranges above are estimates derived from published margins of error using the Census Bureau’s guidance.
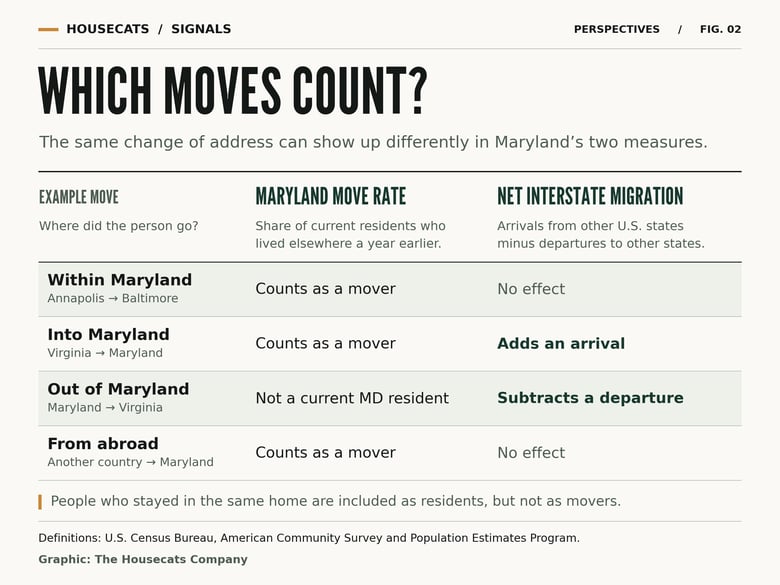
A move from one apartment to another in the same Annapolis building can count. So can a move to Annapolis from Baltimore or from another state. A former Maryland resident who moved to another state and still lives there is in that state’s current population. The Maryland rate doesn’t count that person as a mover out of Maryland. Nor is it a count of moves during the intervening year: someone who left and came back to the same home can have the same address at both ends.
How a state can lose residents while its move rate barely changes
Maryland’s State of Housing presentation includes a separate analysis of net interstate migration in 2022. The estimated balances were −17,333 for ages 25–34 and −4,061 for ages 35–44. A negative balance means more people in the age group left Maryland for other states than arrived from them. These are estimates from a different analysis and year, not components of the 2025 percentages.
Net migration subtracts departures from arrivals. Residential mobility asks how many current residents changed homes, including those who stayed in Maryland. Picture two households swapping homes across a county line within the state: they contribute movers to the second measure and nothing to interstate migration. Or picture one person arriving from Virginia while one person leaves for Virginia: there is movement in both directions but no net gain. The choice of measure changes the story before anyone starts debating a cause.
Housing costs are real. Their effect can point in opposite directions.
Maryland’s Statewide Housing Needs Assessment reports that about 50.3% of renter households were cost-burdened in its pooled 2018–2022 data, spending at least 30% of household income on rent. That is a meaningful reason to examine the cost of moving. It is an estimate for renter households across ages in an earlier period, not the share of 25-to-44-year-olds who stayed put because of rent in 2025.
Consider what a rent increase might do. One household might move promptly to escape it. Another might need to move but have less cash left each month to pay the upfront costs. A third might absorb the increase because its current location saves a second commute. Those are plausible mechanisms, not findings about how often any of them occurred. A broad move rate can stay level even if the balance of such experiences changes. The surveys used here do not identify the counterfactual: who would have moved if an affordable, workable alternative had been available?
A better comparison when a lease or job offer is on the table
Start with a real alternative. A quoted rent in another town means little until you know whether the home is actually available on your move date and whether the trip to work is feasible at the time you have to make it. Put the present and alternative arrangements side by side. Keep three questions separate:
- What changes every month? Compare actual housing payments, utilities, parking, travel and any other costs that move with the address. A lower rent can still produce a more expensive routine.
- What has to be paid before the move makes sense? Deposits, movers and overlapping payments can make a lower monthly cost inaccessible today. A deposit you may get back still has to be available on moving day.
- Which parts of the current arrangement would have to be replaced? Access to care, a workable schedule, a person who can collect a child, or a nearby family member can carry value that a housing-payment comparison misses.
For an employer, the corresponding question is not simply whether an employee is willing to relocate. It is which part of the proposed arrangement fails: the recurring expense, the transition expense, or the daily schedule. Those problems call for different responses. The same logic matters to anyone interpreting demand for homes: a person who would like a different home but cannot make the timing work looks like a nonmover in the survey.
What would change the conclusion?
Another comparable year of age-specific data would tell us whether the recent estimates persist. A consistent longer series would be needed to rank them historically. County-level work would need appropriate geography, sample size and survey period. To test the stronger claim that households are stuck, we’d want evidence about desired moves that did not happen and why: actual alternatives, moves considered and abandoned, or the costs that made a particular option unworkable. The statewide count alone cannot supply those answers.
Maryland’s move rate for this age group was effectively level across the two estimates. That does not make housing pressure imaginary, and it does not turn every renewed lease into proof of constraint. If you’re weighing a move, start with the alternative you could actually take. The useful comparison is between two workable lives, not between your address and a statewide percentage. Which cost or constraint would make the difference for you? We’d be interested to hear.