
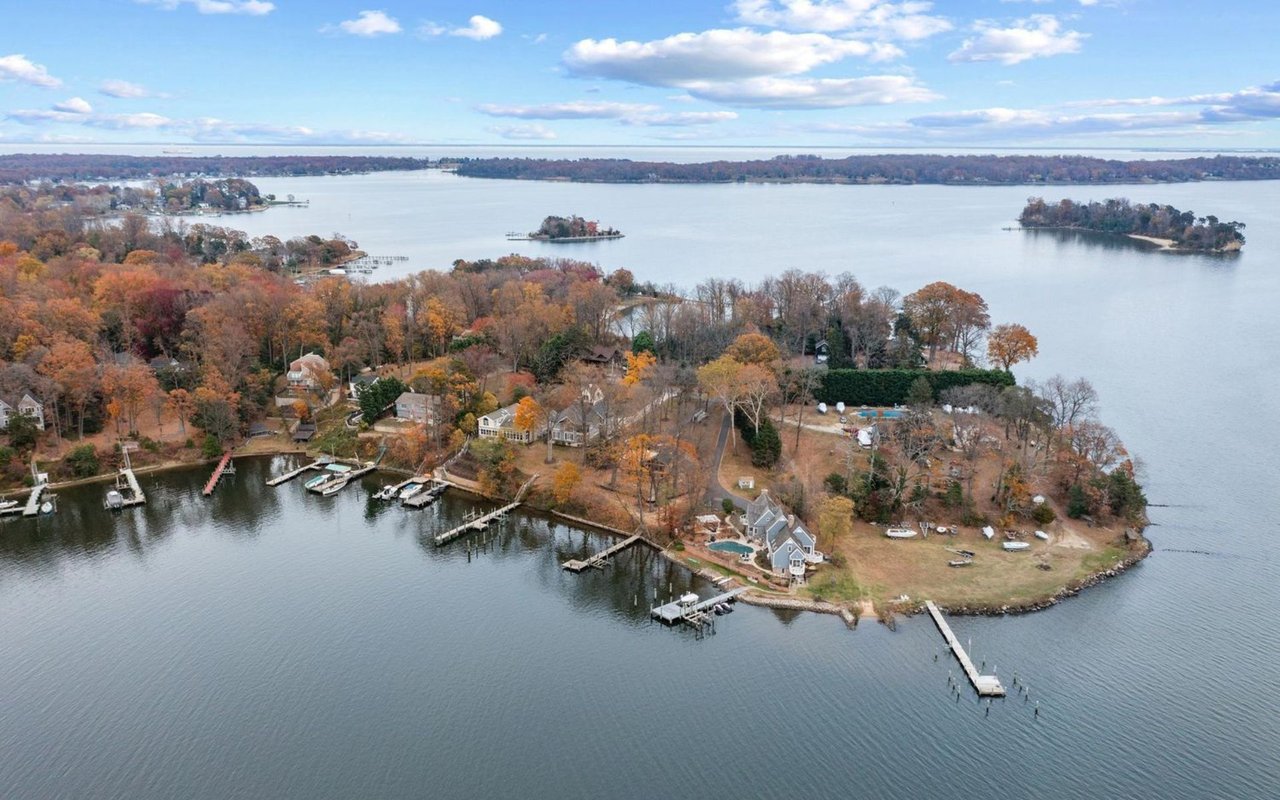

November 2024 introduced further evolution in the Greater Annapolis real estate market, with notable shifts in both the luxury and waterfront segments. From changes in average pricing to fluctuations in sales activity and days on market, these trends reflect ongoing adjustments in buyer behavior and seller strategies. Let’s dive into the data to understand how these factors shaped the market this month.
Introduction
As the year winds down, the Greater Annapolis market continues to exhibit resilience despite ongoing challenges. The luxury and waterfront segments remain key drivers of activity, with pricing, sales volume, and market timelines reflecting seasonal shifts. This report highlights the latest trends in these two segments, offering insights for buyers and sellers looking to navigate the market effectively.
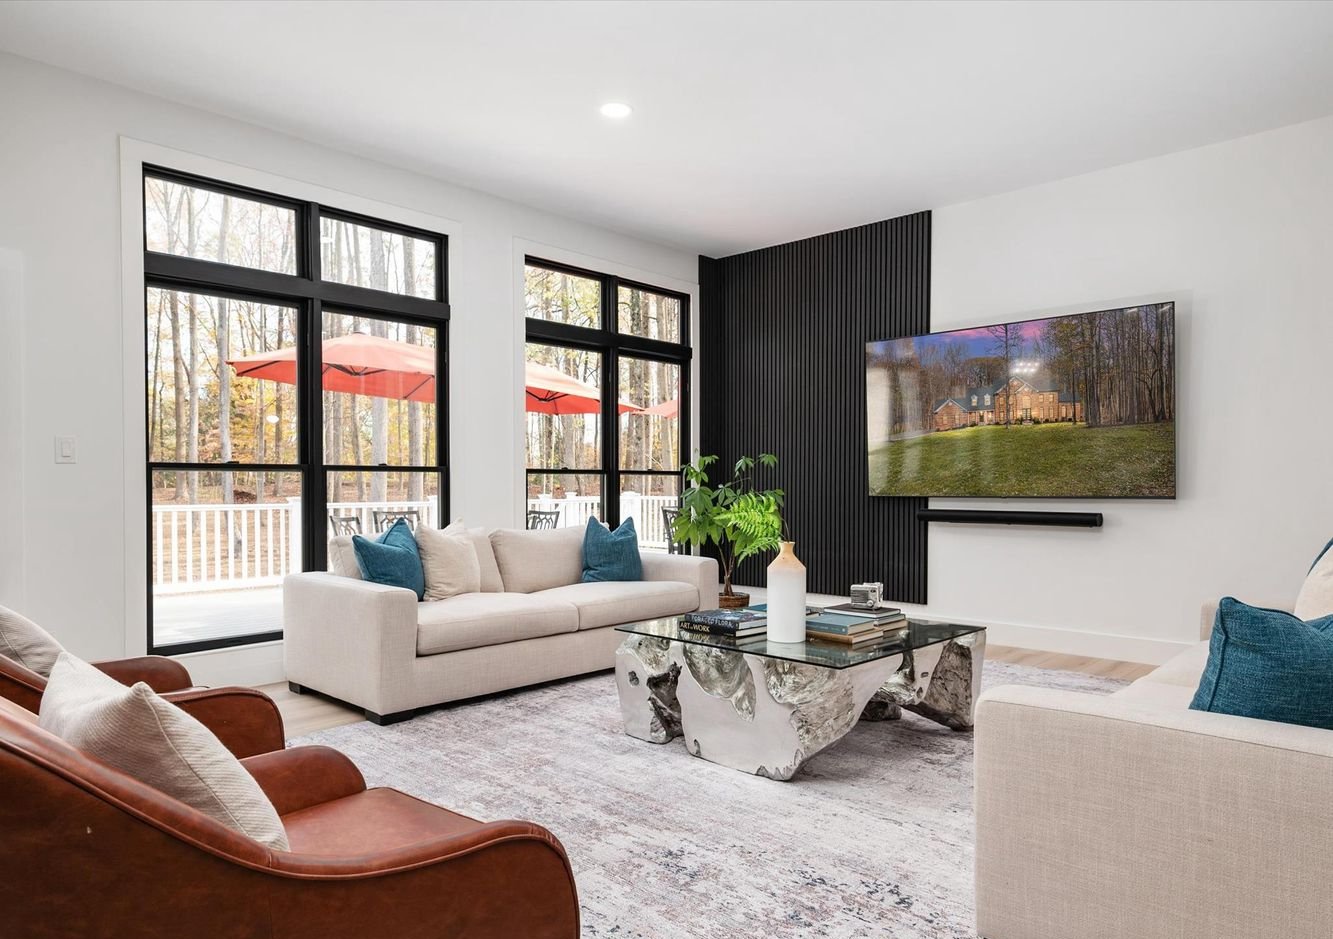
Greater Annapolis Market Overview
The Greater Annapolis market in November 2024 presented a mixed picture:
- Average Sale Price: The luxury segment recorded an average price of $1,442,546, a 13.5% decline month-over-month (MoM) and a 21% drop year-over-year (YoY). Similarly, the waterfront segment saw an average price of $1,153,437, down from $1,619,486 in October and $1,734,864 in November 2023.
- Days on Market (DOM): Properties in both segments spent less time on the market compared to October. Luxury properties averaged 23 days, down from 58, while waterfront properties averaged 50 days, compared to 64 in October.
- Total Sales: Luxury transactions fell to 31, down from 48 in October, while waterfront sales decreased to 19 from 25 in October.
These shifts indicate a seasonal cooling but suggest opportunities for both buyers and sellers willing to adapt.
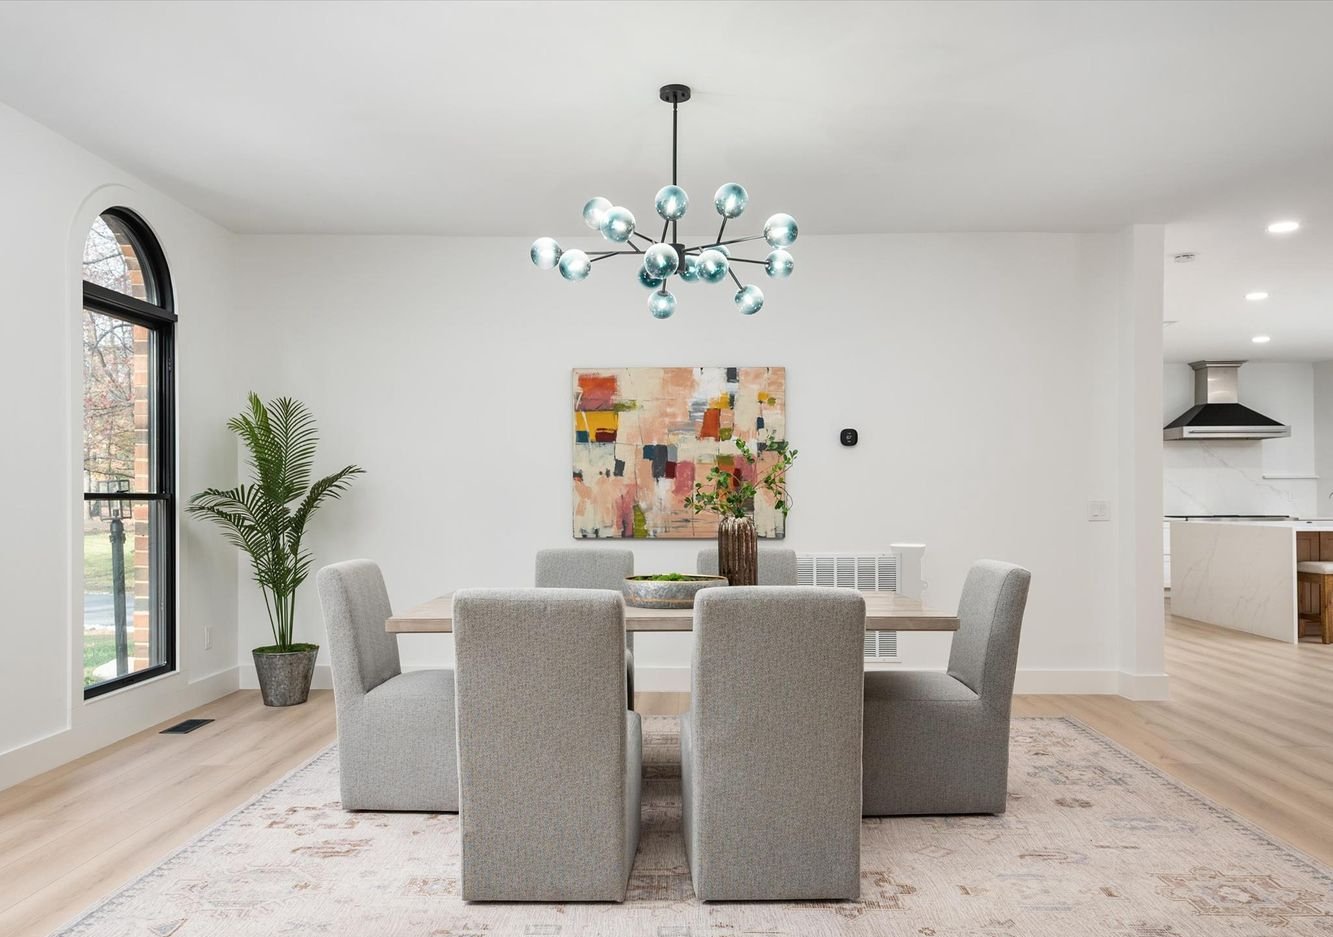
Luxury Market
The luxury market, encompassing properties priced at $1M+, showcased the following key trends:
Annapolis Luxury | Nov 2024 | Oct 2024 | Nov 2023 |
Average Price | $1,442,546 | $1,668,689 | $1,825,499 |
Days on Market | 23 | 58 | 30 |
Total Sales | 31 | 48 | 38 |
List Price To Sales Price | 97.9% | 93.6% | 98.3% |
Analysis
- Pricing: November’s average sale price for luxury properties fell significantly MoM and YoY, reflecting buyer caution and seasonal market shifts.
- Speed of Sales: Luxury properties moved off the market more quickly in November, with average DOM dropping to 23 days from 58 days in October, suggesting stronger buyer urgency.
- Sales Volume: The total number of luxury transactions decreased by 35% MoM, as sellers adjusted to a more selective buyer pool.
- Negotiation Power: The list price-to-sale price ratio improved to 97.9%, showing buyers and sellers are reaching agreements more closely aligned with list prices compared to October.
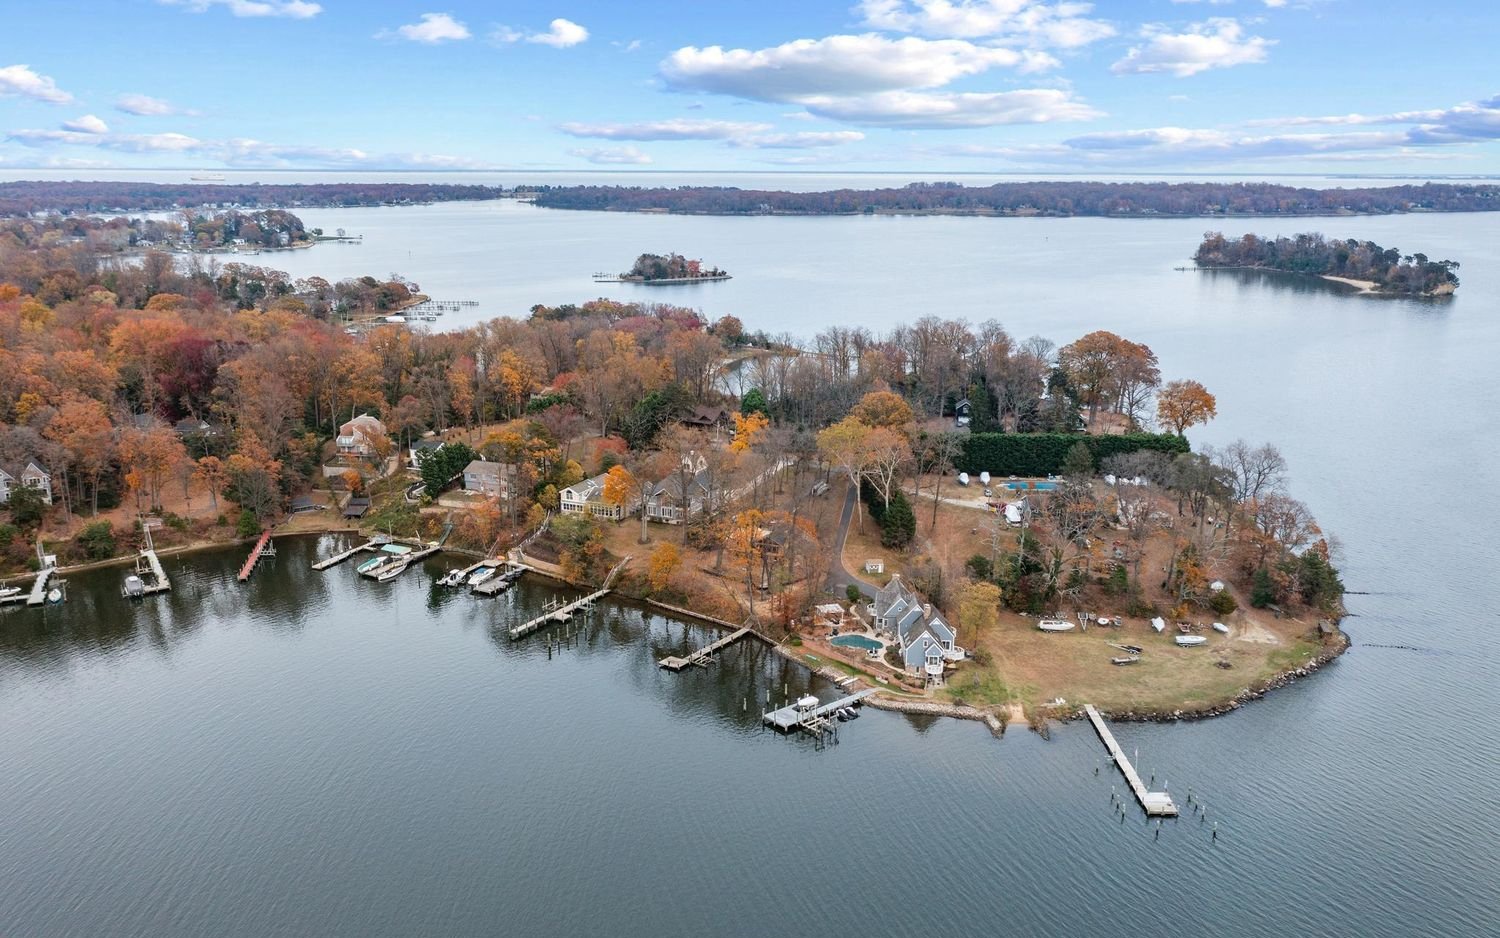
Waterfront Properties
Waterfront properties, a hallmark of Annapolis real estate, showed distinct market dynamics:
Annapolis Waterfront | Sept 2024 | Oct 2024 | Nov 2023 |
Average Price | $1,153,437 | $1,619,486 | $1,734,864 |
Days on Market | 50 | 64 | 44 |
Total Sales | 19 | 25 | 25 |
List Price To Sales Price | 96.8% | 94.8% | 92.8% |
Analysis
- Pricing: The average price for waterfront properties dropped by 28.8% MoM and 33.5% YoY, suggesting an adjustment in buyer preferences and inventory availability.
- Market Speed: The average DOM decreased to 50 days, reflecting faster decision-making by buyers compared to October’s 64 days.
- Sales Volume: Waterfront sales decreased to 19 transactions, showing typical seasonal slowdowns as the market prepares for winter.
- Negotiation Power: The list price-to-sales price ratio improved to 96.8%, highlighting sellers’ ability to close deals closer to asking prices.
Let's Look at the Average Property in Each Market in Nov '24.
Market | Beds | Baths | Square Feet | PPSF |
Annapolis Luxury | 4 | 4 | 3,937 | $490.59 |
Annapolis Waterfront | 4 | 3 | 2,489 | $568.03 |
Top 10 Sold Listings
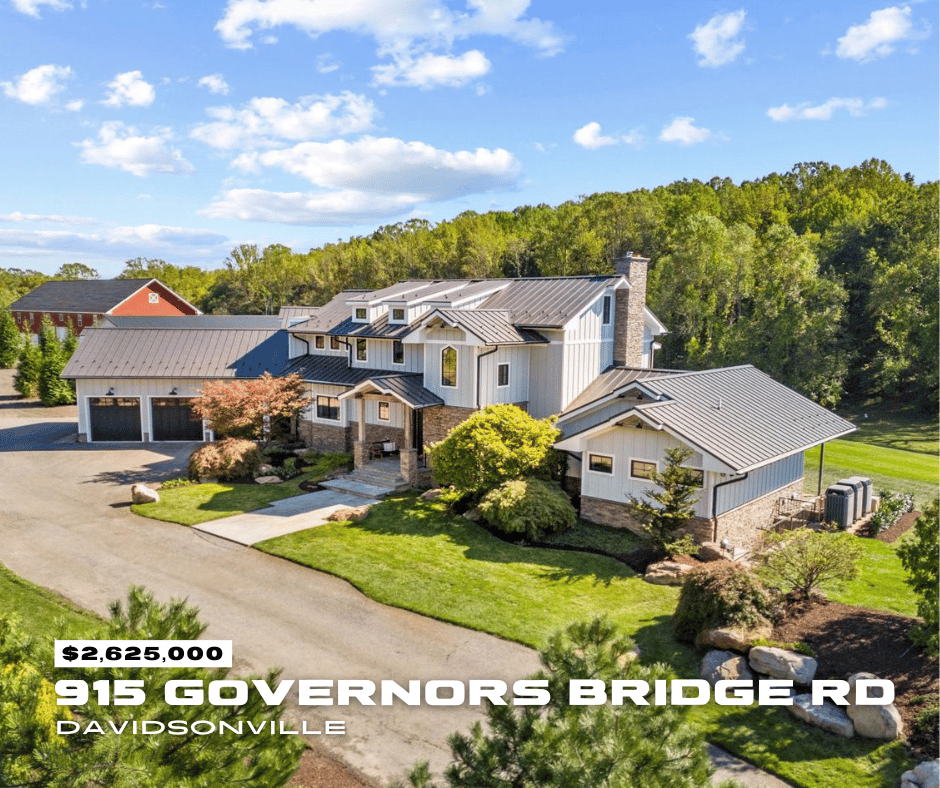
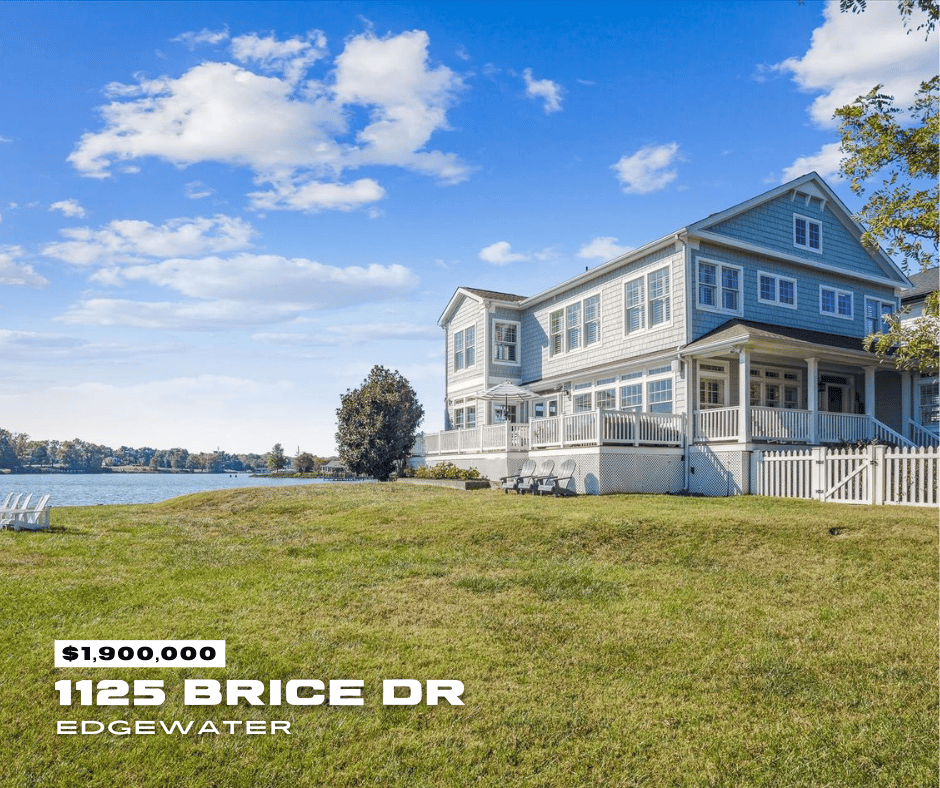
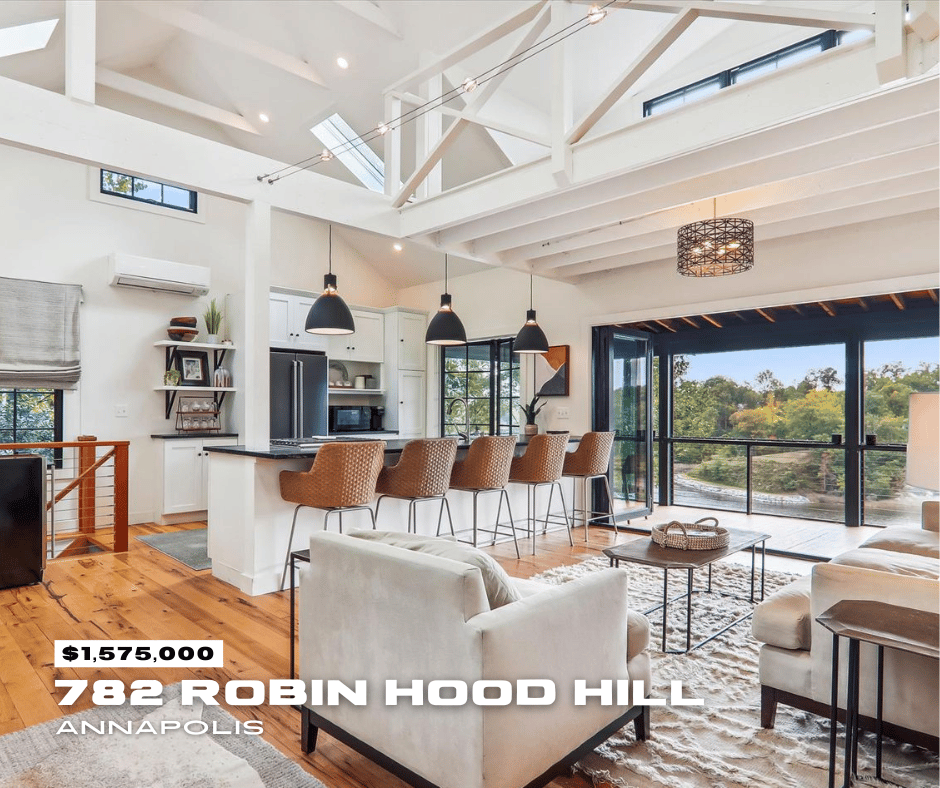
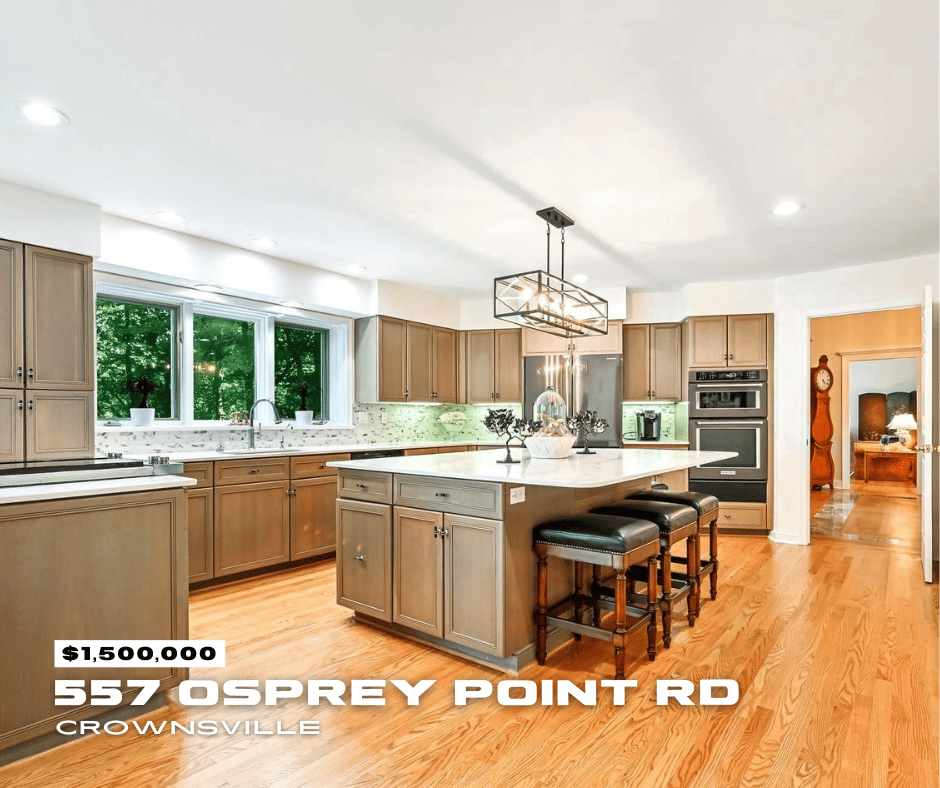
Intrigued by the top 10 listings that set the real estate market abuzz in October? Here are some of the standout properties that resonated with buyers:
 |  |  |  |  |  |  | 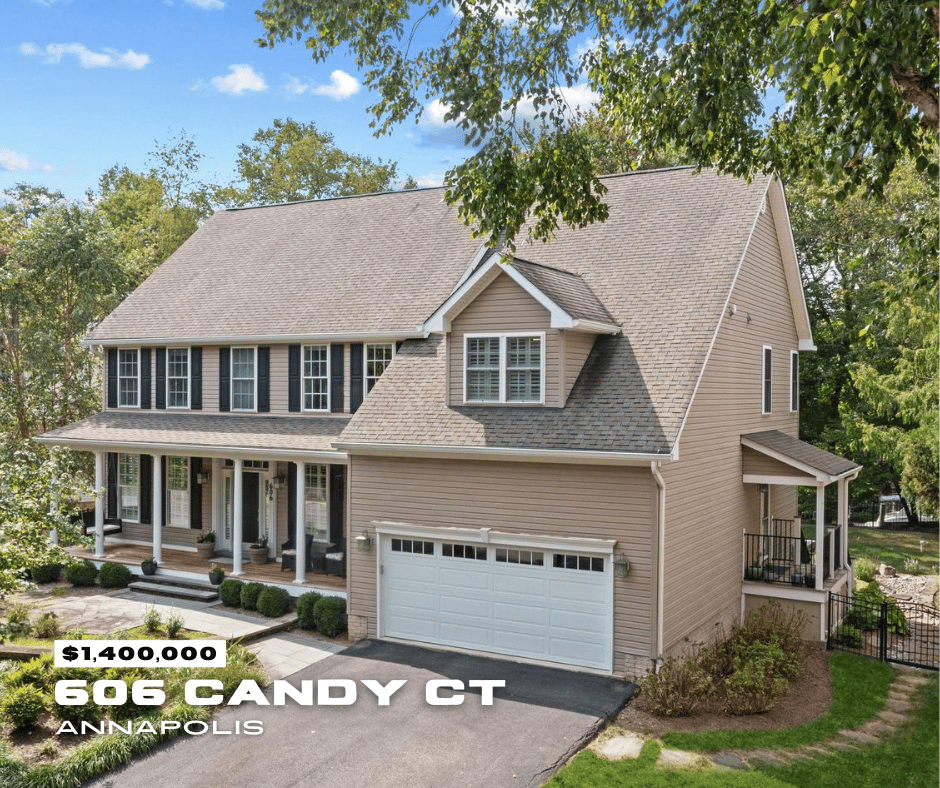 |  |  |
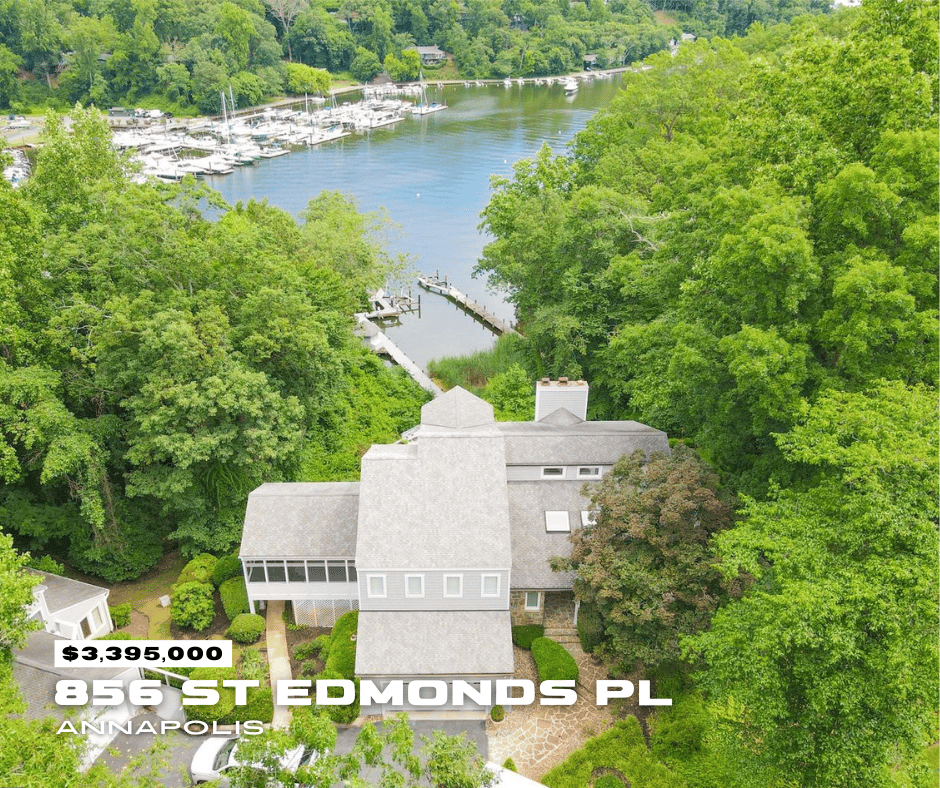
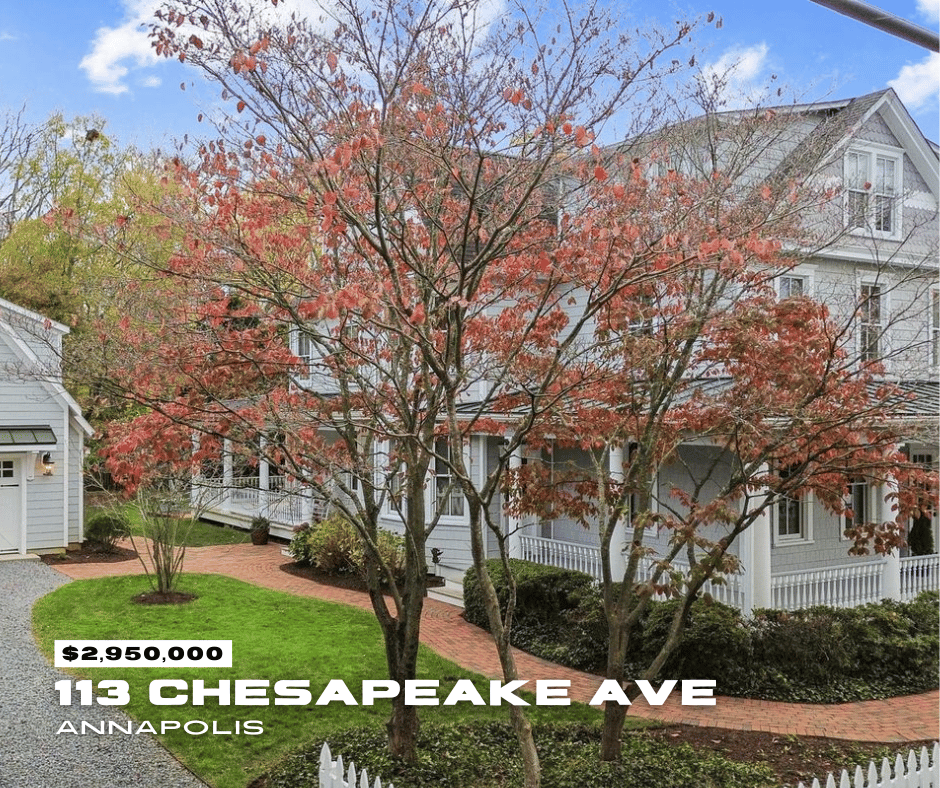
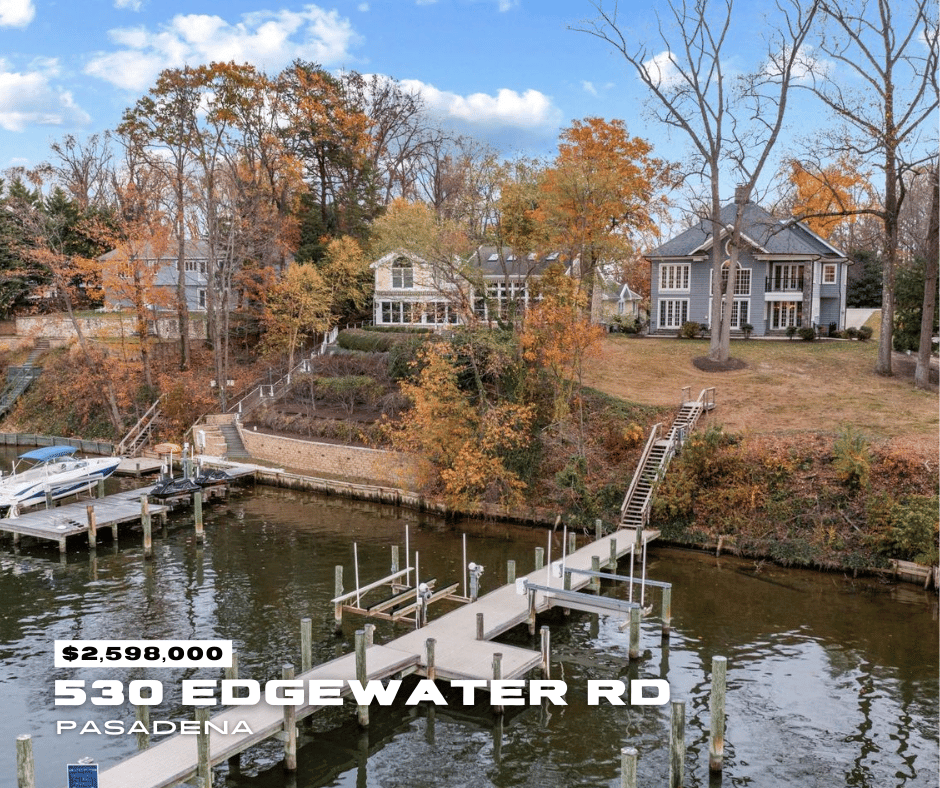
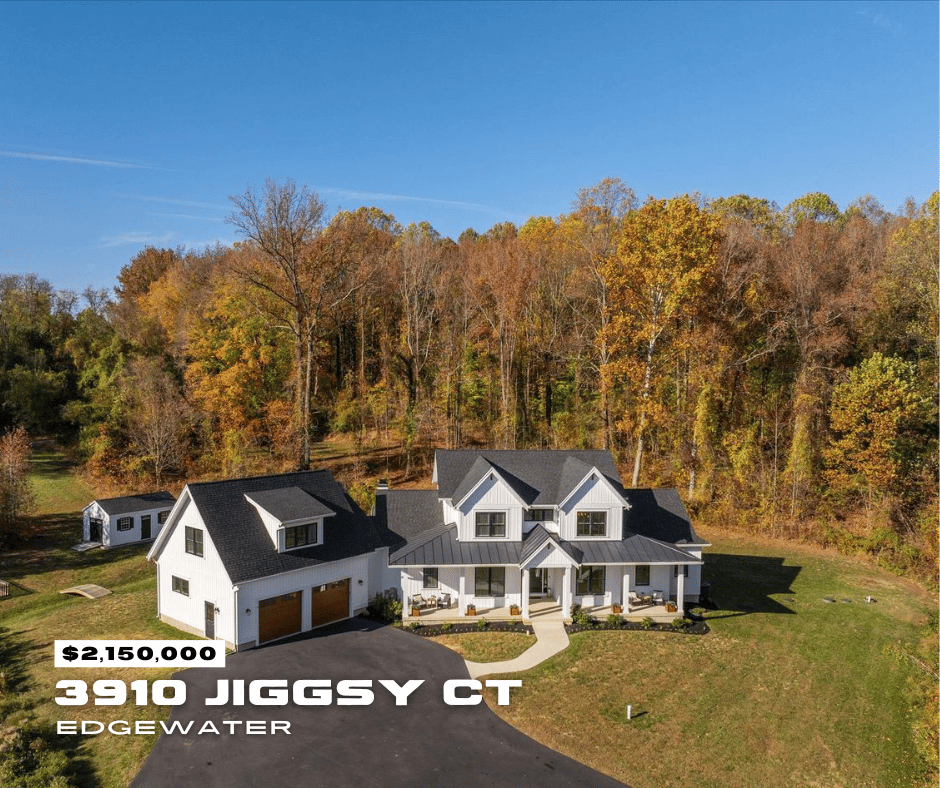
Top 10 New Listings
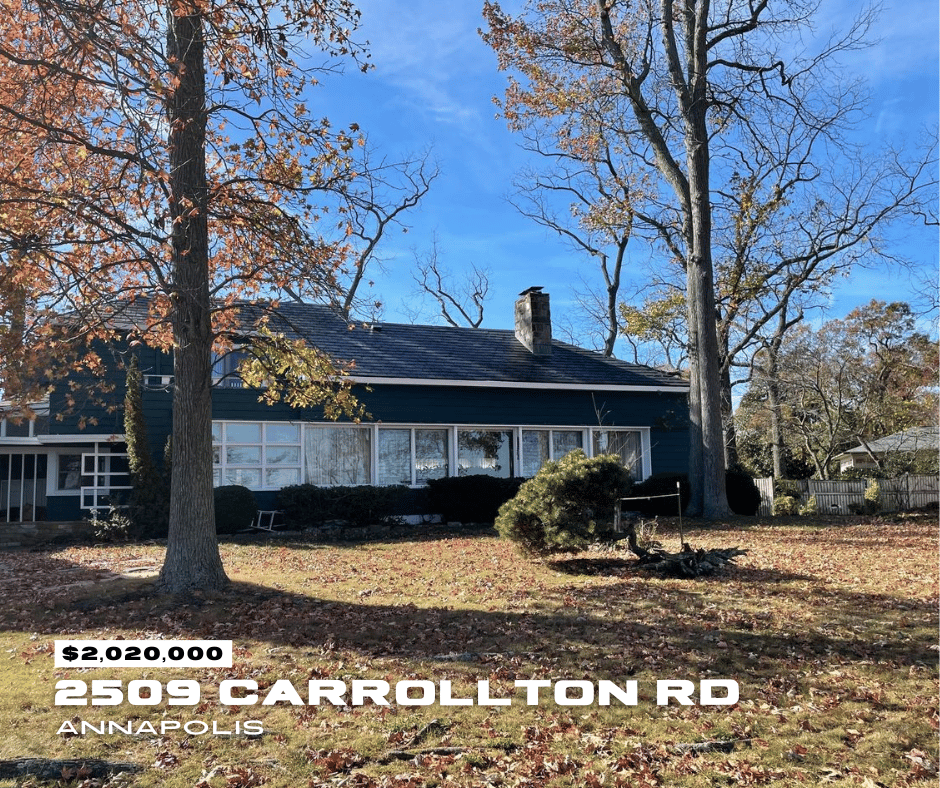
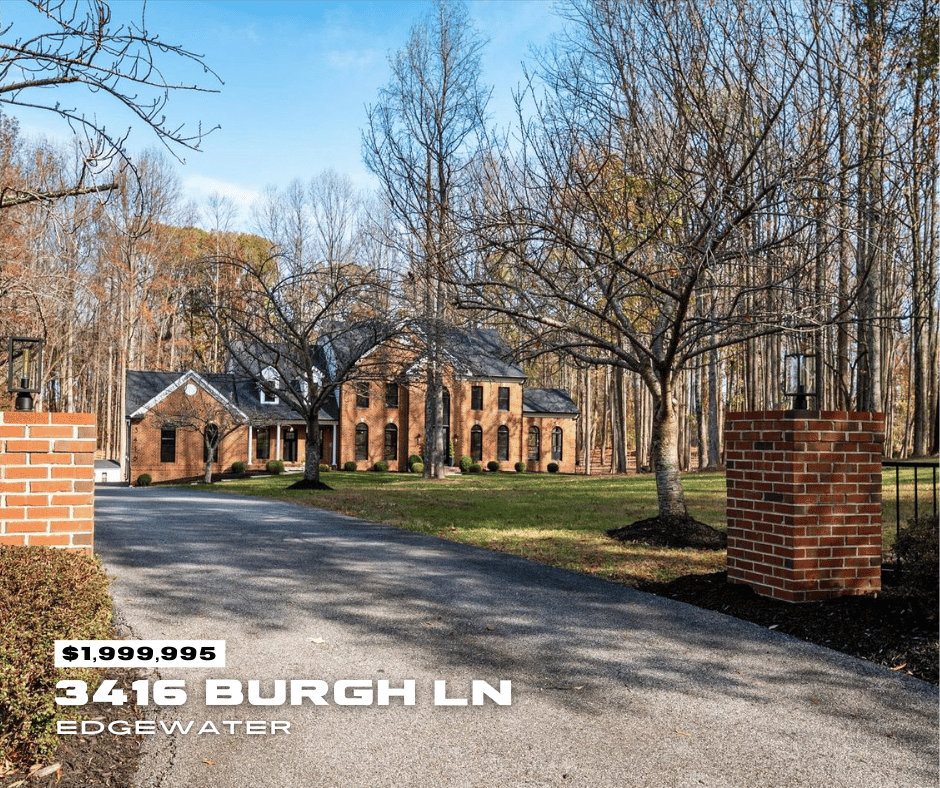
The excitement doesn't end with the sold properties. Here are the top 10 new listings that made a grand entrance into the real estate arena, poised to capture the attention of eager house hunters:
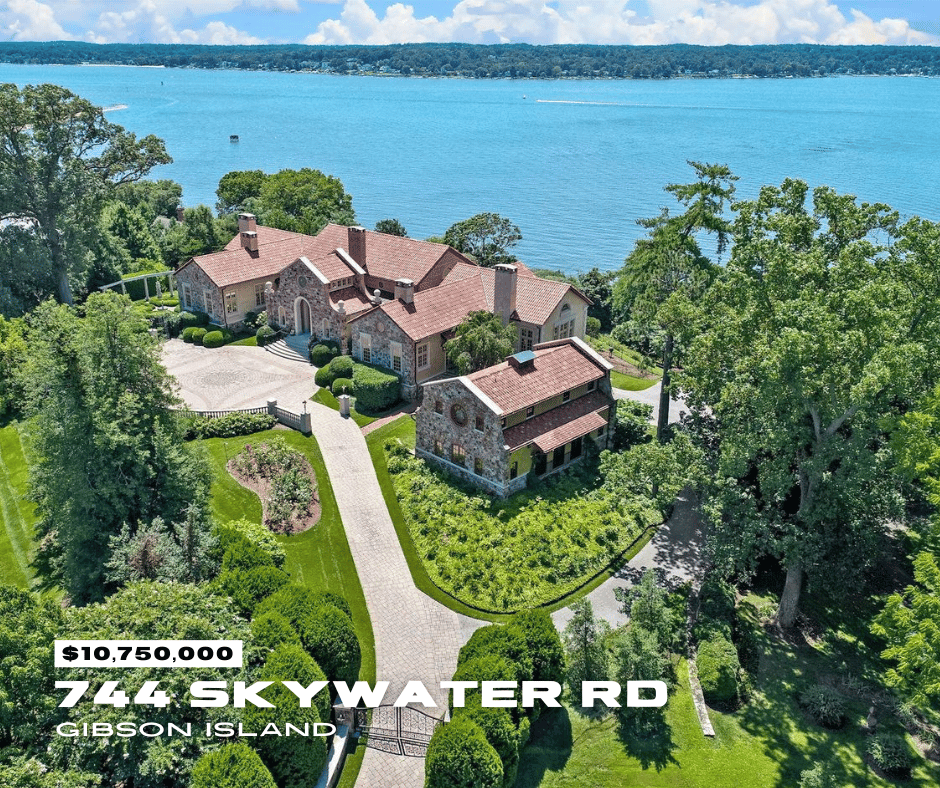 | 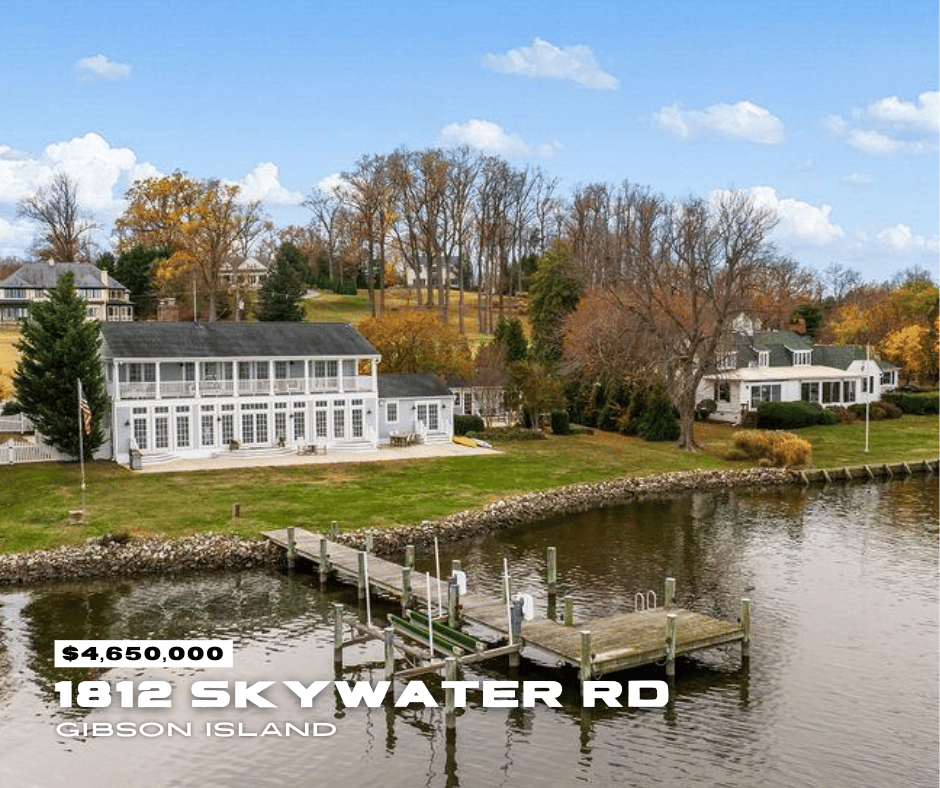 | 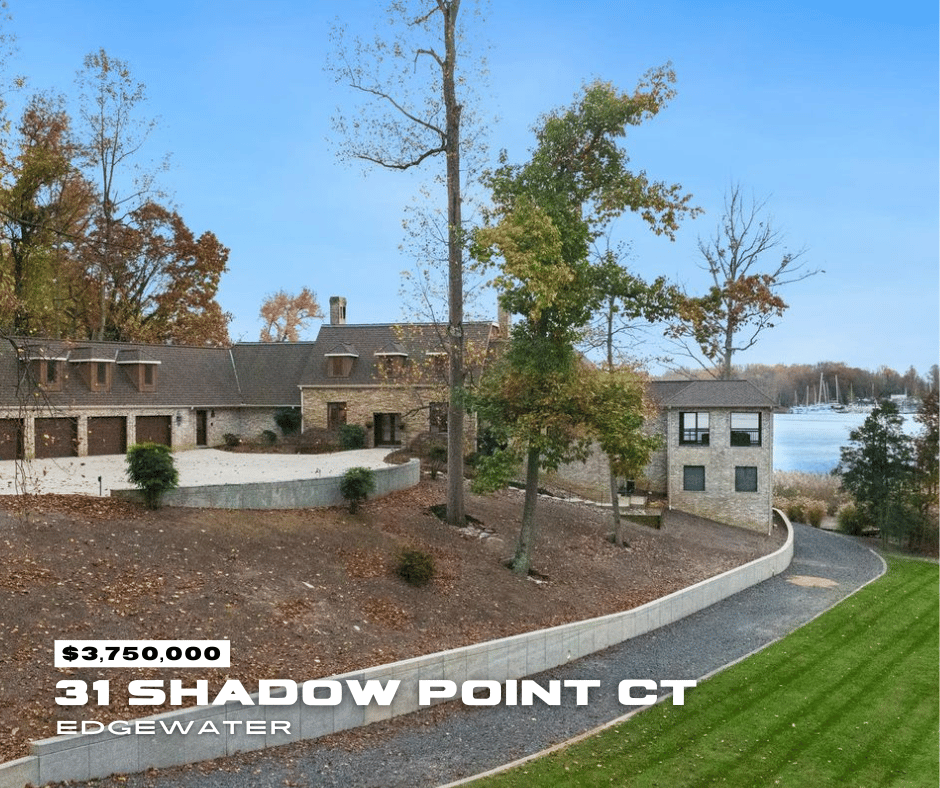 |  |  |  |  |  |  |  |
Buyer & Seller Insights
For Buyers
- Luxury Market: Buyers have increased leverage as prices continue to soften, but faster-moving inventory suggests less time for deliberation.
- Waterfront Market: The drop in average prices creates opportunities for buyers to secure high-value properties at more competitive prices.
For Sellers
- Pricing Strategy: Strategic pricing remains critical to attract buyers in a competitive and cautious market.
- Marketing Focus: Highlight unique features such as waterfront views or high-end finishes to maximize interest and secure faster sales.
Forecast & Recommendations
As we move into December and the holiday season:
- Market Trends: Expect a seasonal dip in sales activity, with pricing likely to remain stable or decline slightly.
- Inventory: Tighter inventory levels will favor motivated sellers who price competitively.
- Opportunities for Buyers: With less competition, buyers can negotiate favorable terms, especially
In Conclusion
November 2024 highlighted the shifting dynamics of the Greater Annapolis real estate market, particularly within the luxury and waterfront segments. While prices softened, faster market activity and improved list price-to-sales ratios indicate that motivated buyers and sellers are finding common ground.
The luxury market continues to adapt to evolving buyer priorities, with pricing and negotiation trends reflecting broader market shifts. Meanwhile, waterfront properties remain highly desirable, though buyers are exercising patience and selectivity in their decisions.
For personalized guidance on buying or selling in the Greater Annapolis market, reach out to our team. We’re here to help you navigate the complexities of this ever-changing market with confidence.